Unit 1 – Problem Solving (Exercise Questions)
1.1. Answer the following questions:
Q.1. In a farm, there are some cows and birds. If there are total 35 heads and 110 legs, then how many cows and birds are there?
Q.2. Define problem analysis. Explain your answer along with an example.
Q.3. Define an algorithm and argue on its role and importance in problem solving.
Q.4. Suppose a problem has multiple algorithms. How would you choose the most efficient one. Explain with examples.
Q.5. How do you determine requirements for a flowchart?
Q.6. Explain types of test data.
Q.7. Describe a trace table.
1.4. Draw the flowcharts for the following problems:
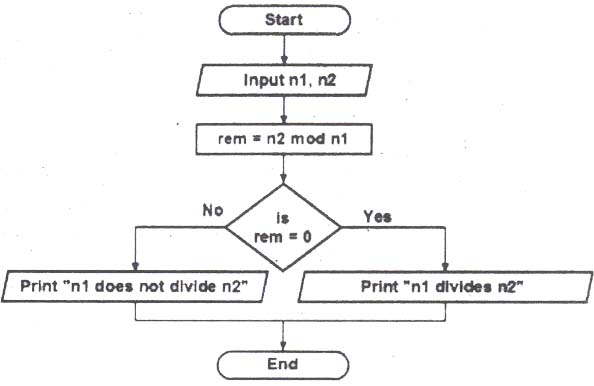
- Input two numbers n 1 and n2. Determine whether n 1 divides n2 or not.
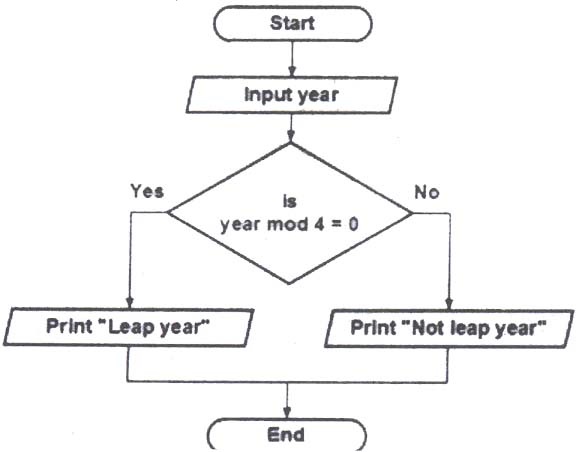
- Input a year and determine whether it is a leap year or not.
- Input a number and calculate its factorial.
- Find LCM (Lease Common Multiple) of two numbers.
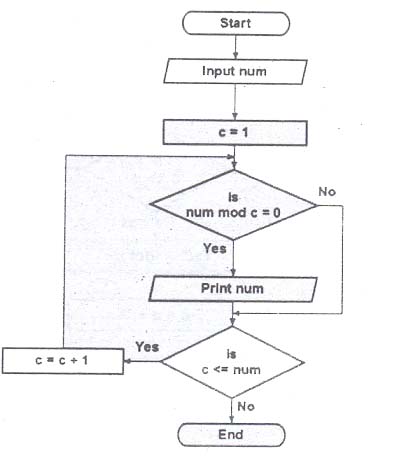
- Input a number and display its factors.
Q.1. In a farm, there are some cows and birds. If there are total 35 heads and 110 legs, then how many cows and birds are there?

Answer:
If there are total 35 heads and 110 legs. then there are 20 cows and 15 birds in the farm. Each cow has four legs and each birds has two legs.
Q.2. Define problem analysis. Explain your answer along with an example.
Answer:
Problem Analysis I Understanding a Problem
Problem analysis is a process of understanding the given problem. It is very important to understand a problem before trying to solve it. A clear understanding of a problem helps the user to solve it correctly and easily. It also saves money, time and resources. For example, a riddle or puzzle can be solved easily after understanding it properly.
 Figure: Puzzle
The following figure represents a problem to be solved. The red light represents a problem, the yellow light represents its analysis and the green light represents its solution. It shows that problem analysis brings us closer to the solution.
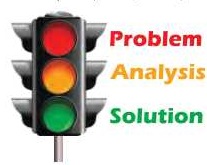
Figure: From problem to solution
Q.3. Define an algorithm and argue on its role and importance in problem solving.
Answer:
Algorithm
An algorithm is a finite number of steps to solve a problem. The steps given in the algorithm are in a specific order. These steps must be followed in the same sequence to solve the problem. The steps may consist of input process, decision and output. The word “algorithm” comes from the name of Arabic writer Muhammad ibn
Musa al-Khwarizml.
Example
An algorithm to make tea is as follows:
Step 1: Start
Step 2: Take a kettle.
Step 3: Put water in the kettle.
Step 4: Put the kettle on fire.
Step 5: Add milk and sugar.
Step 6: Wait till boils
Step 7: Remove the kettle from fire.
Step 8: End
Role of Algorithm in Solving a Problem
An algorithm plays an important role in solving a problem. It provides a step-by- step guide to solve a problem. It is a complete description of the solution. The process of solving a problem becomes simpler and easier with the help of algorithm.
The computer programmer usually writes an algorithm first. The algorithm is then translated into computer program using any programming language. Sometimes, the user first draws the flowchart and then converts it- into an algorithm.
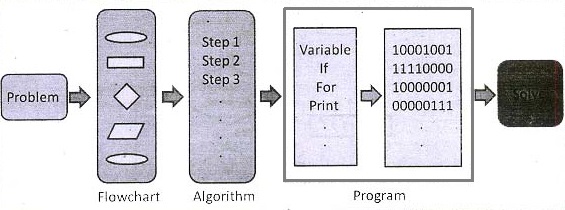
Figure: Solving a Problem
Q.4· Suppose a problem has multiple algorithms. How would you choose the most efficient one. Explain with examples.
Answer:
Efficiency of Algorithms
A problem may be solved with multiple algorithms. Each algorithm is different in efficiency. The most efficient algorithm should be selected to solve the problem. The efficiency of an algorithm is measured on the basis of two factors as follows:
1. Number of Steps
The number or steps in algorithm is an important factor to measure its efficiency. An algorithm is more efficient if it takes less number of steps to solve problem.
2. Space in Computer Memory
The solution of’ a problem may need to store data in computer memory. For example, the input data and the results of any calculations are stored in the memory. The space in memory is also an important factor to measure the efficiency of an algorithm. An algorithm is more efficient if it takes less space in computer memory.
An algorithm may have more number of’ steps but may. take less memory space. Another algorithm may have less number of steps but may take more memory space. The algorithm must be selected according to the requirements. An algorithm that takes less memory space may be selected if the computer does not have much memory space.
Example 1
Suppose a problem can be solved with two different algorithms. The algorithm 1 solves the problem in 10 steps. The algorithm 2 solves the problem in 15 steps. In this situation, algorithm 1 is considered more efficient than algorithm 2.
Example 2
Suppose the sum of the following series is required:
1 +2+3+4+5+ … +99
The above problem can be solved in different ways as follows:
Solution 1
Start from number 1 and keep on adding all numbers till 99. The result is 4950.
Solution 2
- Make pairs of the numbers such as (1+99), (2+98), (3+97) … (49,51) where each pair gives the answer
- Count total number of pairs which is 49 and multiple it with 100. The result will be 49 x 100 = 4900.
- Add 50 as it cannot fit in any pair. The result is 4900 + 50 = 4950.
Solution 3

Each of the above solution solves the problem in different number of steps. These solutions may take different memory space if they are used in computer.
Q.5. How do you determine requirements for a flowchart?
Answer:
Determining Requirements for a Flowchart
The user must determine different requirements for the given problem before constructing a flowchart. These requirements are as follows:
- Input
- Processing
- Decision Making
- Output
Input
The first step is to clearly determine the input to the flowchart. It is the data that is taken from the user. The input is determined from the problem statement. It is important to know the required number of inputs and their types.
Processing
The second step is to determine the type of processing required to get the output. The. processing is used to perform calculations and store the results. Some examples of processing are increasing or decreasing a value, adding, subtracting, multiplying or dividing the numbers etc.
Decision Making
Another important step is to determine the decision making in the flowchart. Some steps are performed based on a condition. Decision making is the process to check if a statement is true or false and perform the appropriate steps accordingly.
Output
The last step is to provide the required output. It is the final information that is given to the user in solving a problem.
Q.6. Explain types of test data.
Answer:
It is important to create proper and efficient test data to improve the quality of the solution. Each type of solution may require different types of test data. Different types of test data are as follows: .
1. Valid Test Data
A type of test data that is according, to the input requirements of an algorithm is called valid test data.
Example
Suppose an algorithm requires a positive number between 1 and 50 to calculate the square of the number. Any number from 1 to 50 will be considered as valid test data.
2. Invalid Test Data
A type of test data that is not according to the input requirements of an algorithm is called invalid test data. It is important that the algorithm handles invalid data properly and shows relevant messages.
Example
Suppose an algorithm requires a positive number between 1 and 50 calculate the square of the number. Any number out of this range will be consider as invalid test data such as -1 and 63. The algorithm should notify the user that the
input is wrong.
3. Boundary Test Data
The smallest or the largest data values from the range of valid test data is called boundary test data. An algorithm is tested with the boundary test data to ensure that handles these values correctly.
Example
Suppose an algorithm requires a positive number between 1 and 50 calculate the square root of the number. The values 1 and 50 will be considered boundary test data.
4. Wrong Data Format
The wrong data format means the values that are different than valid test data.
Example
Suppose an algorithm requires a positive number between 1 and 50 calculate the square root of the number. The wrong data format for this algorithm can be the values such as A “Hello” and -5.9 etc. It is always good to check how the solution works with the wrong data formats .
5. Absent Data
The absent data means that the number of values given to the solution is less than expected.
Example
Suppose an algorithm requires three numbers to find the largest one. The algorithm should give relevant message to the user if the number of inputs is less than three. It is important to check how the solution works with the absent data.
Q.7. Describe a trace table.
Answer:
Trace Table
A trace table is a technique of testing the algorithm to ensure that it does not have any logical errors. The trace table usually consists of multiple rows and columns. Each column shows the name of the data element. Each row shows the value of data element in each step.
Example
The following algorithm finds the factorial of 5:
Step 1: Start
Step 2: Set n = 5
Step 3: Set c = 1
Step 4: Set fact = 1
Step 5: If c <= n Then Set fact = fact x c Else Goto Step 8
Step 6: Set c= c + 1
Step 7: Goto Step 5
Step 8: Print fact
Step 9: End
The following trace table indicates the values of each data elements in each step. It can be used to check the value of different data elements in different steps. It helps in identifying and correcting any logical errors in the algorithm. The blank cell in the table means there is no change. The symbol – means that a value is not related to the step.
| n | c | fact | |
| Step1 | – | – | – |
| Step2 | 5 | – | – |
| Step3 | 1 | ||
| Step4 | 1 | ||
| Step5 | 1 | ||
| Step6 | 2 | ||
| Step7 | |||
| Step5 | 2 | ||
| Step6 | 3 | ||
| Step7 | |||
| Step5 | 6 | ||
| Step6 | 4 | ||
| Step7 | |||
| Step5 | 24 | ||
| Step6 | 5 | ||
| Step7 | |||
| Step5 | 120 | ||
| Step6 | 6 | ||
| Step7 | |||
| Step8 | |||
| Step9 |
Explanation
Step 1: It indicates the start of the algorithm. It has no effect on any value.
Step 2: It sets the value of n to 5. It has no effect on c and fact.
Step 3: It sets the value of c to 1. It has no effect on n and fact.
Step 4: It sets the value of fact to 1. The value of n and C is not changed
Step 5: It calculates fact = fact x c and stores the result 1 in fact.
Step 6: It sets the value of c to 2.
Step 7: It has no effect on any value and moves the control back to Step 5.The same process repeats until the condition c <= n becomes false and the algorithm ends after displaying the value of fact.
1. Input two numbers n 1 and n2. Determine whether n 1 divides n2 or not.
Answer:
2. Input a year and determine whether it is a leap year or not.
Answer:
3. Input a number and calculate its factorial.
Answer:
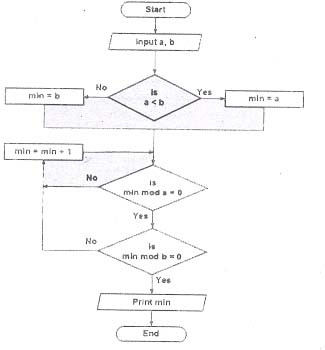
4. Find LCM (Lease Common Multiple) of two numbers.

5. Input a number and display its factors.
Answer:
